How much food will a week’s earnings buy?
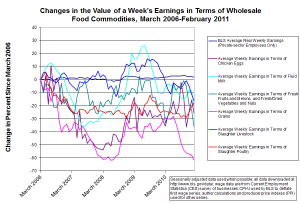
byRecent months have seen double-digit increases in energy prices and the prices of many important agricultural commodities. Because of the recent inflation in various raw materials, fuels, and foods, many ordinary Americans have been finding it increasingly difficult to afford basic necessities. The figure above shows just how severe this trend has been. (You will probably need to click on the image to make it larger.)
The lines for various commodity groups begin on the left side of the figure at a level of zero percent for the March 2006 observation. Each subsequent point on a given line shows the total percentage change since March 2006 in the amount of one type of farm product that can be purchased at the wholesale level with the average weekly paycheck. The dark blue line that appears nearly flat shows average real (inflation-adjusted) weekly earnings as reported by the government. The Bureau of Labor Statistics (BLS) uses the consumer price index (CPI-U) to deflate this series. The line shows that the purchasing power of wages for a typical job has increased by only about 2.2 percent over the five-year period shown in the figure. Moreover, ground has been lost since early last fall, when wages were as high as 3.3 percent above March 2006 levels.
The other lines in the figure refer to average nominal weekly earnings deflated by various wholesale food price indexes. Each line represents a different type of agricultural commodity. Since wholesale commodity prices tend to rise and fall a great deal more than most consumer prices, the lines representing earnings in terms of food commodities appear much more volatile than the blue line representing overall real earnings. I have tried to include most of the foods that are crucial for U.S. retail purchasers, resulting in the use of 6 of the 8 main BLS commodity indexes that fall under the broad “farm products” category. One can think of the resulting real wages conceptually as the living standards of workers who for some reason use their entire paychecks to buy only one type of farm commodity.
All 6 lines show losses of purchasing power since the start of the time period covered by the graph, reflected in observations at the right side of the figure that lie below zero percent. One example is grain purchasers, who have fared worst among farm-product buyers, according to my chart, suffering a 61.6 percent loss in the grain equivalent of a typical private-sector paycheck since March 2006. Many observers believe that the current commodity price run-up has resulted from an upturn in economic activity that began roughly at the official end of the last recession, while others blame adverse weather trends due to global climate change. Both of these explanations are likely to be of some merit.
Recently, Bank of America research mentioned on the Business Insider website today found that increasing food and energy prices will be high enough this month to wipe out the positive effect on personal income of the payroll-tax withholding reduction that began in January for most U.S. workers. B of A estimates that the tax cut has raised take-home pay by about $8 billion per month, but this year’s food and energy price increases are now costing consumers about the same amount. The macroeconomic effect of this loss of discretionary income could be very important.
Many anti-stimulus economists and politicians have raised the bugaboo that recent upward trends in many commodity prices are the result of “excessive money creation,” a thesis that is effectively challenged by this month’s San Francisco Fed Economic Letter, which uses a promising methodology to gauge the commodity-price impacts of a number of large-scale Fed securities purchases. (Warning: This is a fairly long and technical article for a noneconomist.) In addition, the S.F. Fed’s website also prominently features this interesting graphic, which shows that commodity price increases are likely to hit the lowest income groups hardest, since, for example, food purchases use up about 40 percent of the lowest income quintile’s pretax income, while household utilities account for roughly 20 percent and gasoline perhaps 10 percent of their income. Considering the enormous numbers of low-income households, it is would be very unfortunate if economists overemphasized the somewhat less relevant fact that food and energy costs now amount to a smaller fraction of total U.S. income than they did during the oil and food price shocks of the 1970s.
Yesterday, corn futures prices at one of the main Chicago commodity exchanges hit a ten-year high. This is a frightening trend indeed.
Comments on next page:


