Minsky Meets Brazil (Part III)
byby Felipe Rezende
Part III
This part of the series (see Parts I and II, here and here) will focus on macroeconomic and microeconomic aspects of financial fragility and the provision of liquidity. Minsky’s framework not only sheds light on how to detect unsustainable financial practices, but the position adopted in this paper is that the current Brazilian crisis does fit with Minsky’s instability theory. This is a Minsky crisis in which during economic expansions market participants show greater tolerance for risk and forget the lessons of past crises so economic units gradually move from safe financial positions to riskier positions and declining cushions of safety.
Recall that Part II of this series has suggested a framework that focuses on macroeconomic and microeconomic aspects to financial fragility and provision for liquidity so that economic units can meet their near-term obligations. At the macro level, Minsky-Kalecki-Levy’s profits equation and Godley’s sectoral balances approach provide an alternative approach to understanding what determines stability and provide insight into the dynamics of the adjustment process. Government spending can be seen as an injection of monetary instruments into the non-government sector, providing that which is necessary to pay taxes along with desired net savings of that currency. This is the so-called “vertical relationship” between the government and non-government sectors (Mosler and Forstater 1999; Wray 1998). At the micro level, Minsky’s categorization of debt units – hedge, speculative and Ponzi – along with his Financial Instability Hypothesis shed light on the endemic financial fragility, the relationship between stability and destabilizing forces underlying capitalist debt structures, and boom-bust cycles of market economies. In this framework, at the macro level, government deficits create cash and are needed to provide liquidity to indebted economic units, while at the micro level cash flows can be generated by operating, financing and investment activities.
1. Where Do Profits Come From?
While in a Keynes-Minsky-Godley approach, the sectoral balances approach shed light on understanding all financial flows within the economy, Minsky-Kalecki-Levy’s Profits equation, shows the macroeconomic origins of aggregate profits, that is, in aggregate, we get the following:
P = I + Govdef + NX + Cp – Sw
Where P equals aggregate profits; I = investment; Govdef = the budget deficit; NX = the current account surplus; Cp = spending out of profits; Sw = saving out of wages
While Kalecki-Levy profit equation shows how profits are generated at the macro level (that is, firms cannot increase aggregate profits by slashing wages), at the micro level firms compete for profit flows. By decomposing firms’ return on equity formula, then we get the following:
The return on equity (ROE) equals return on assets (ROA) times leverage, where ROA = Profits / Total Assets; and Leverage equals (Assets / Equity), that is, total assets divided by shareholders’ equity. The return on asset is useful to analyze how effectively firms are converting their investments into profits. If we expand the return on assets formula we get the following:
In Keynes’s model, profit seeking behavior drive capitalists to undertake investment and production with a view for profits. This means that the production activity is organized and directed by firms according to their profit expectations and their decision-making is based upon the uncertain future behavior of markets. That is, the process of aggregation in The General Theory takes place considering the factors that are determined by (q-c), i.e. decisions to invest in instrumental capital goods, non instrumental capital goods such as investment in housing, buildings and so on. That is, to induce investment the demand price must exceed the supply price of capital.
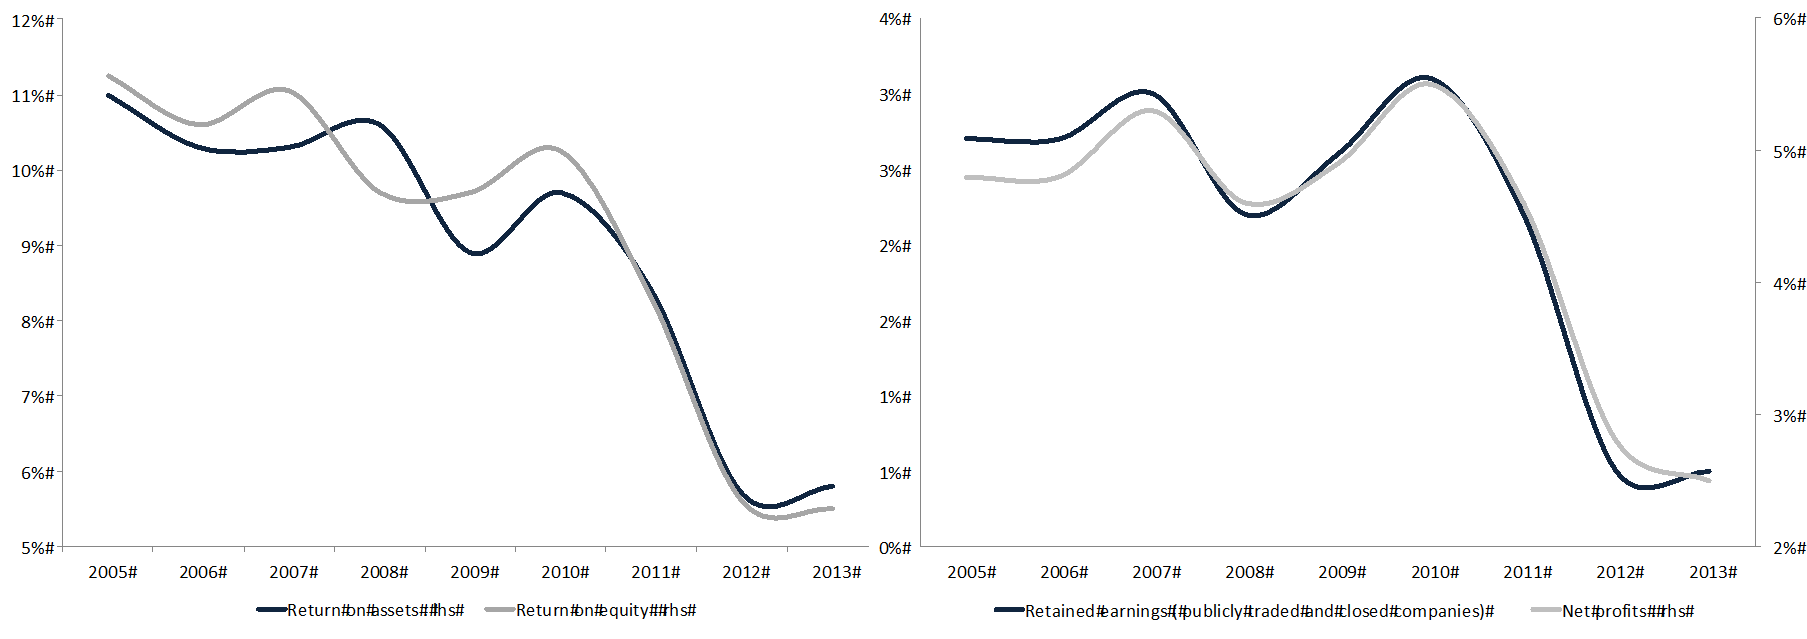
This brings us to the question of why haven’t businesses invested more. Brazilian companies faced declining aggregate profits and return on assets (figure 1).
Figure 1. Publicly traded and closed companies profits and profitability
Source: CEMEC, author’s own elaboration
During economic expansions, high profits and retained earnings can finance new investment boosting economic activity. As this happens, at the macroeconomic level, rising current account deficits put a downward pressure on aggregate profits. This is aggregated by capacity effects given by the “Domar problem”, that is, the additional capacity created by a constant level of net investment further increases the demand gap to fully mobilize resources. The combination of rising current account deficits, slowdown in investment growth and budget deficits took a toll on corporate profitability.
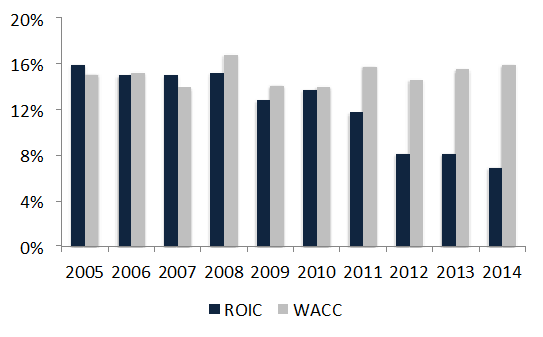
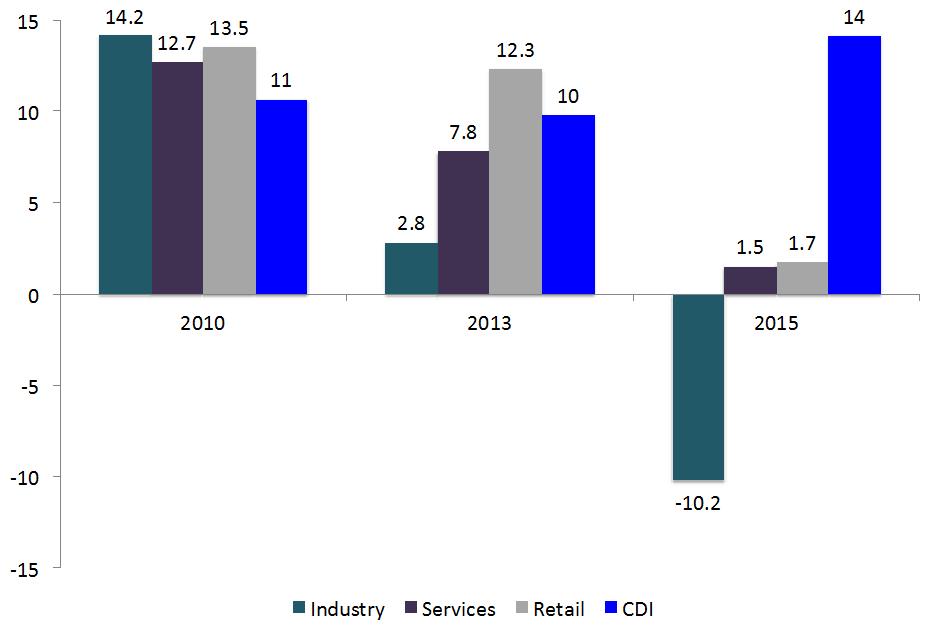
In particular, rising current account deficits put a downward trend on profits, decreasing it by a substantial amount (figure 1). During this period worker’s saving was positive (average of 0.3% of GDP from 2007-2013), which also put a downward pressure on profits. Falling profits caused the sharp decline on returns on assets, which given leverage ratios, reduced ROE (figure 1). Hence corporate earnings (and profitability) are much lower than they have ever been in the past. Declining aggregate profits influenced profitability indicators such as the return on invested capital (figure 2 and 3). Even though all major sectors experienced a sharp decline in profitability from 2010 to 2015, this impact was more profound in the industry sector, which faced negative returns in 2015 (figure 3). It is worth mentioning that the return on capital was substantially below the CDI rate, that is, the daily average of overnight interbank loans.
Figure 2. Return in invested capital and weighted average cost of capital
Source: CEMEC 2015a, author’s own elaboration
Figure 3. Return on Equity and CDI (% p.y)
Source: IEDI, BCB, author’s own elaboration
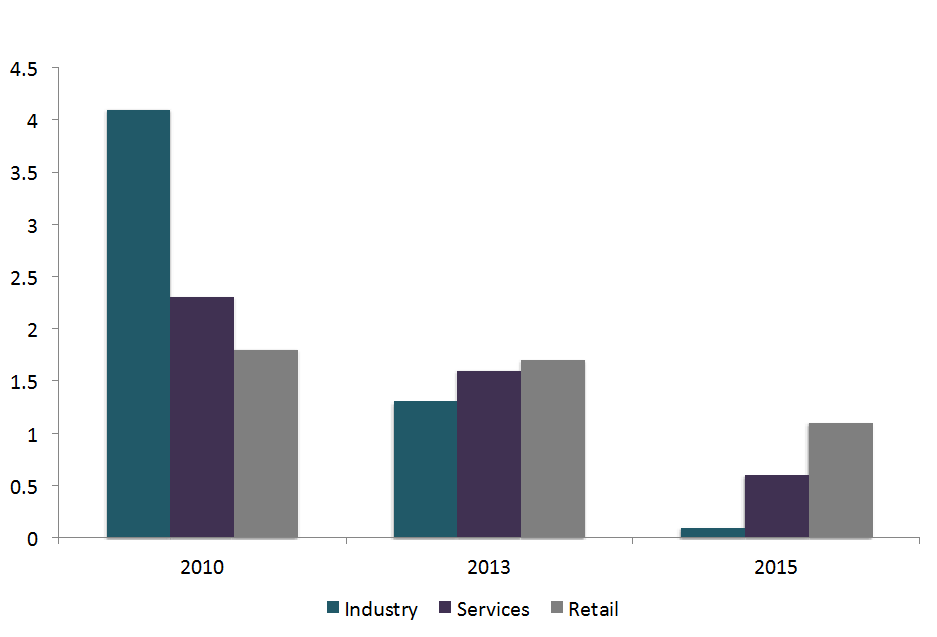
The drive for profits makes economic units to work, increase and maintain their profitability through a combination of rising leverage and return on assets. The rapid expansion of private credit over the past 10 years was a double-edged sword: it contributed to support demand and returns on equity but it deteriorated firms’ cushions of safety (figure 4).
Figure 4. Earnings before income taxes (EBIT) over financial expenses
Source: IEDI, BCB, author’s own elaboration
Because aggregate profits and margins have been compressing and returns declining, investment grew at a slower pace along with declining profit expectations and increased risk perception.
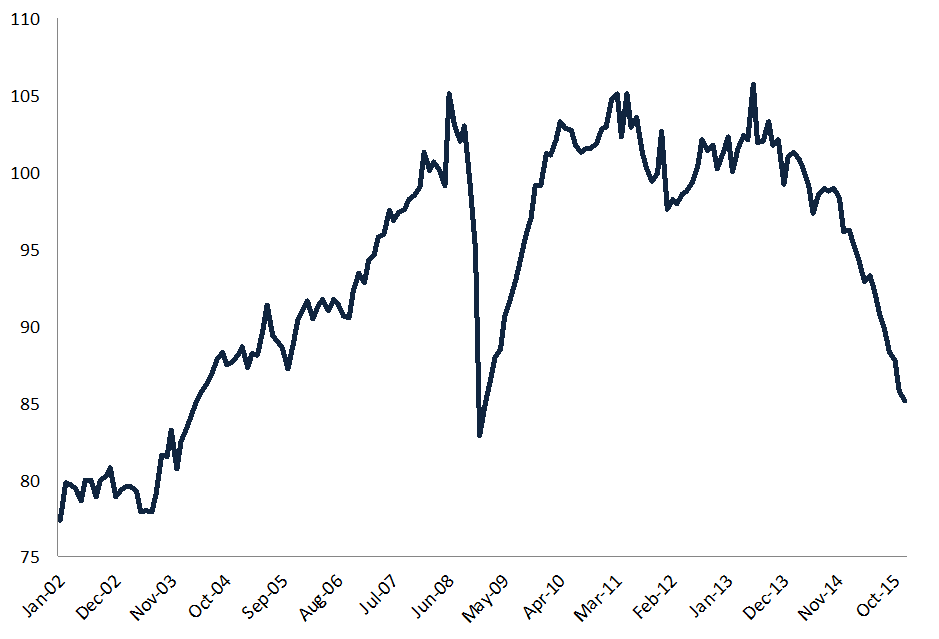
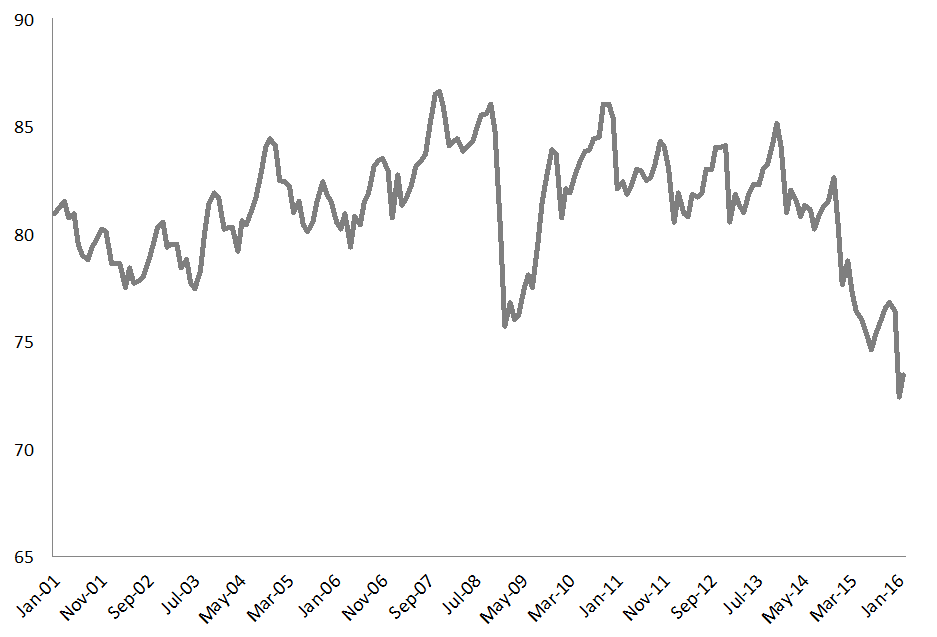
While Keynes investment theory suggested that investment will proceed as long as the marginal efficiency of capital is greater than the interest rate, the recent experience in Brazil shows declining aggregate profits and profitability and increasing leverage among non-financial companies and households, resulted in deterioration of confidence (figure 5). Falling profits and falling business confidence put a downward pressure on investment growth (figure 6). While economists and market pundits have raised the question of why Brazil’s economic performance deteriorated in the aftermath of the 2007-2008 global financial crisis (figure 7 and 8), this happened because aggregate profits and returns collapsed during this period while there was a debt overhang.
Figure 5. Confidence Index (FGV) – seasonally adjusted
Source: BCB
Figure 6. Business cycle: fixed investment and GDP growth (four-quarter moving average of year-over-year change)
Source: IBGE
Figure 7. Industrial production index – s.a. (2002=100)
Source: BCB
Figure 8. Capacity utilization – manufacturing industry (FGV) – %
Source: BCB
While the conventional argument has pointed to falling commodity prices and fiscal expansion as the cause of Brazil’s 2014-15 recession (Bresser 2015), it was the failure to sustain aggregate profits and expected future profitability along with declining cushions of safety that has sharply reduced the return on assets, which pushed the demand price of capital below the supply price, thus reducing investment.
With the collapse in commodity prices in 2014 and a widespread corruption case that affected public and private investment, they finally knocked off the economy and drove the country into a major recession in 2015. That is, Keynes-Minsky’s investment theory of the cycle seems to fit the Brazilian economy.
This is a Minsky’s crisis in which during economic expansions market participants show greater tolerance for risk and forget the lessons of past crises so economic units gradually move from safe financial positions to riskier positions and declining cushions of safety.
The dynamics of Brazil’s current crisis can be summarized as follows: the Brazilian experience shows that while the household sector balance was in a surplus (spending less than its income), firms ran increasingly large deficits (with the exception in 2009 when the government adopted stimulus measures, which generated large enough government deficits that more than offset the current account deficit). The business sector as a whole is in deficit, so the private sector’s deficit is entirely due to firms’ expenditures that greatly exceed incomes.
However, an expansion fueled by private sector deficit spending lead to the over indebtedness of the private sector. In Brazil, the combination between growing current account deficits along with the overindebtnedness of the business sector have generated record private sector deficits. Though the private sector deficit as a whole was not in deficit until 2011, as the household sector, as a whole, was not in deficit during the entire period. That is, the private sector’s deficit spending was entirely due to firms’ expenditures that greatly exceed their incomes. This increase in nonfinancial corporate sector indebtedness was, in turn, accommodated by domestic bank credit and bond issuance in the domestic and foreign markets.
Following Brazil’s upgrade to investment grade status by Standard & Poor’s and Fitch in 2008, low interest rates in global financial centers since the aftermath of the 2007-2008 global financial crisis have pulled Brazilian non financial companies to tap international markets. During this period, augmented by the perception that the nation was one of the most promising economies, Brazilian corporate issuers have sharply increased their external borrowing.
That is, the increase in non-financial corporate indebtedness was accommodated by domestic credit expansion and debt denominated in foreign currencies including a strong inflow of foreign direct investment – which reinforced the tendency to generate current account deficits through profit and dividends remittances and the debt service.
The surge in capital inflows along with the accumulation of international debt by non-financial companies during the boom years, worsened the tendency towards the deterioration in the foreign account caused by the outflows created on the factor service account – represented by debt service and profit and dividends remittances. Alongside the business sector deficit spending for a long period of time, the combination between the deterioration of trade and the current account balances and the reliance on external funding added another layer of endemic economic instability. In this regard, there was a self-reinforcing cumulative process that continued to reinforce the tendency towards deterioration in the external accounts, which was similar to a Ponzi scheme.
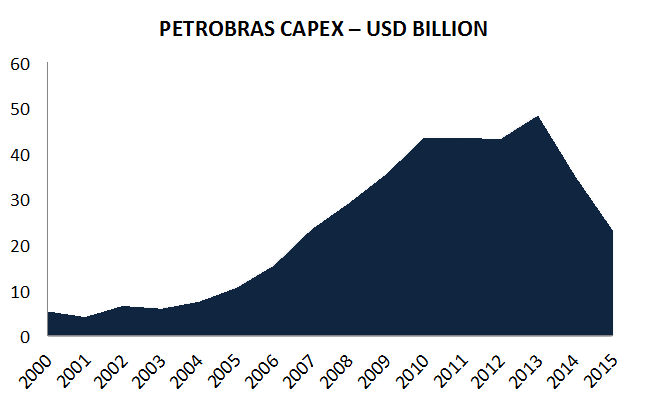
As this happens, investment started to grow at a slower pace, both the trade balance and the current account balance deteriorated, workers’ saving remained positive – and with Brazil’s oil company faced with lower oil prices, rising debt, and a massive corruption scandal – Petrobras, which was a major public investment driver, cut is investments in 2014 and 2015 (figure 9) generating ripple effects throughout the economy. These forces put a downward pressure on aggregate profits. Along with it, firms experienced declining returns on assets and attempted to increase their return on equity by using borrowed funds.
Figure 9. Petrobras CAPEX – USD billion
Source: Petrobras
2. The Failure of Structural Adjustment Policies
With the Brazilian policy response to the 2007-2008 Global Financial Crisis, Lula’s second term (2006-2010) introduced a more flexible primary budget surplus target to respond to the state of the economy. During this period, private debt accelerated relative to GDP along with the shift from a surplus balance to a private sector deficit so that the underlying structural weaknesses in the Brazilian economy – the overindebtnedness of the business sector, and in particular, private external debt accumulated through capital inflows.
As Brazil navigated relatively smoothly through the 2007-2008 Global Financial Crisis, which led to a fast recovery in 2010, the central bank diagnosed an overheating economy and initiated a series of interest rate hikes from 8.75% in April 2010 to 12.50% in July 2011 and also led to an early withdrawal of policy stimulus in 2011. The government proposed a R$ 50 billion spending cuts and the monetary authority introduced a series of macroprudential measures to curb credit growth and dampen risk in the financial system (see Da Silva and Harris 2012).
As a result, Brazil’s economic growth was sharply reduced in 2011 and 2012. Rousseff’s first term was characterized by the the so-called, “New Economic Matrix”, a policy initiative[1] aimed at reducing real interest rates, Brazil’s tax burden, and promoting exchange rate depreciation to improve the competitiveness of the Brazilian economy and lift economic growth. This policy aimed at reducing investment costs and support profit margins.
Rousseff’s first term from 2010-2014 was marked by an attempt to replace the neoliberal macroeconomic policy “tripod”, that is, floating exchange rate, primary surplus targets, and inflation targeting, which was established during former president Fernando Henrique Cardoso’s second term to get assistance from the International Monetary Fund (IMF) to deal with Brazil’s 1998-99 currency crisis[2]. This macroeconomic policy framework was reinforced during former president Luiz Inácio Lula da Silva’s first term from 2002-2006 (see Arestis et al 2008).
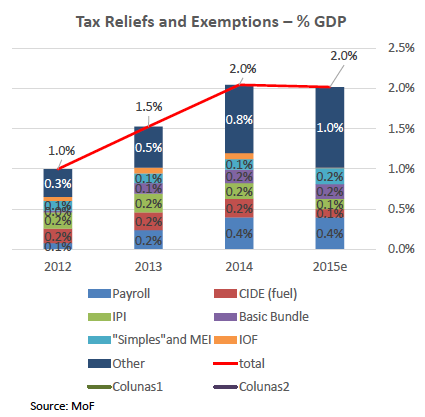
The Brazilian federal government also announced an ambitious investment program based on public private partnerships and concessions to the private sector in key areas such as logistics, energy, and oil and gas. Moreover in an attempt to reduce Brazil’s well-known high tax burden, stimulate economic activity, and keep inflation under control, former Finance Minister Guido Mantega introduced a series of tax cuts (figure 10). The government authorized the Treasury to provide loans to its public banks to allow them to support the investment program.
Figure 10. Tax Reliefs and Exemptions (% of GDP)
Source: The Ministry of Finance, 2016a
Though ad hoc tax breaks caused fiscal revenues to decline it was too small and poorly designed to influence the demand price of capital, stabilize aggregate profits, and promoting a substantial economic growth. By reducing the policy interest rate and using public banks as a policy tool, it was believed that Brazil would initiate a new phase of economic growth.
However, those measures did not succeed in reversing the negative trend in fixed investment spending growth. Though there have been attempts to explain the causes of this dismal performance of fixed investment spending, as discussed in the previous sections, the conventional analysis overlook the impacts of declining aggregate profits, rising indebtedness of the private sector, and falling demand price of capital assets relative to the supply price.
Though the government response attempted to stimulate investment by reducing the supply price of capital, not surprisingly, this policy failed to prevent a sharp decline of investment because the demand price of capital – that is, expected future cash flows (net proceeds) of an investment project – were falling faster than the supply price.
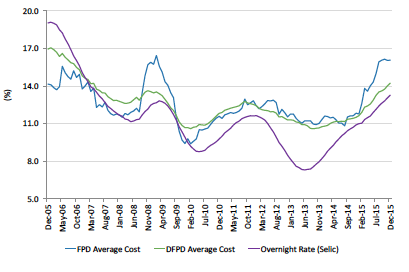
With the exchange rate devaluation since 2011, aggravated by the US Federal Reserve’s “taper tantrum” in May 2013, it was followed by monetary policy tightening in Brazil (figure 11) in attempt to stabilize the exchange rate, control inflation, and curb capital outflows.
Figure 11. Average Selic rate (% p.y) and average cost of domestic public debt (DFPD) and federal public debt (FPD)
Source: Ministry of Finance 2016
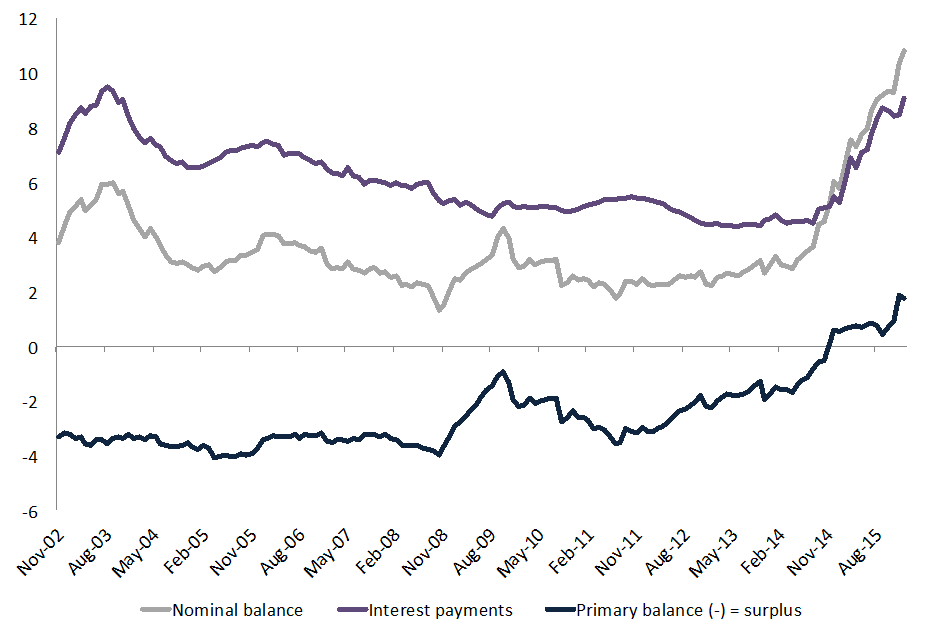
Rousseff’s administration faced fierce attacks in the previous election cycle from anti-Worker’s Party groups and right wing media arguing that the current crisis is a failure of government due to its actions and interventions, not the normal operation of the free market. With the introduction of policy stimulus through ad hoc tax breaks for selected sectors seen as a failure to boost economic activity and the deterioration of the fiscal balance (figure 12) – which posted a public sector primary budget deficit in 2014 after fifteen years of primary fiscal surpluses – opponents argued that that government intervention was the problem. It provided the basis for the opposition to demand the return of the old neoliberal macroeconomic policy tripod and fiscal austerity policies.
Figure 12. Government balance % of GDP (accumulated in 12 months)
Source: BCB
Following a narrow election victory in 2014, the Rousseff administration moved sharply in the direction of fiscal austerity, causing policy to drift back to the “normal” neoliberal proscriptions despite the success of earlier progressive policies. The tight election reflected the perception of a downward trend of the nation’s economic outlook augmented by news that Brazil’s economy has fallen into recession in the first and second quarters of 2014. This outcome did not look like the election the Workers’ Party expected. Brazil’s unemployment rate has hit record lows, real incomes have increased, bank credit has roughly doubled since 2002, it has accumulated US$ 376 billion of reserves as of October 2014 and it has lifted the external constraint. The poverty rate and income inequality have sharply declined due to government policy and social inclusion programs, it has lifted 36 million out of extreme poverty since 2002. Moreover, the resilience and stability of Brazil’s economic and financial systems have received attention as they navigated relatively smoothly through the 2007-2008 global financial crisis.
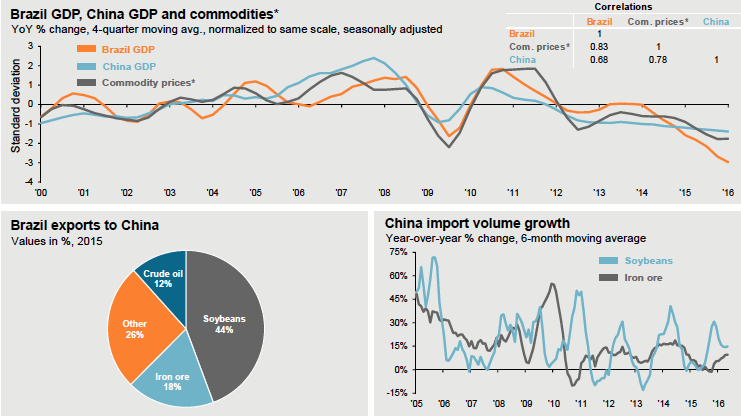
So, what happened? The reason is fairly obvious, in the aftermath of the global financial meltdown, policy makers misdiagnosed the magnitude of the crisis, the changing circumstances because of it, and ended up withdrawing stimulus policies too early. This was aggravated by the failure to make an effective transition to promote domestic demand strategies and the collapse in commodity prices, which affected commodity-producing countries (figure 13). With the slowdown of global demand – particularly from China – the end of the commodity price cycle, negative terms of trade effects, changes in global financing conditions, the Brazilian economy entered in a recession spiral. It was the collapse in business investment spending that pushed the Brazilian economy into its worst recession in 25 years, which was aggravated by the implementation of austerity measures in the middle of the private sector deleveraging cycle.
Figure 13. Brazil GDP, China GDP and commodity prices
Source: JP Morgan 2016
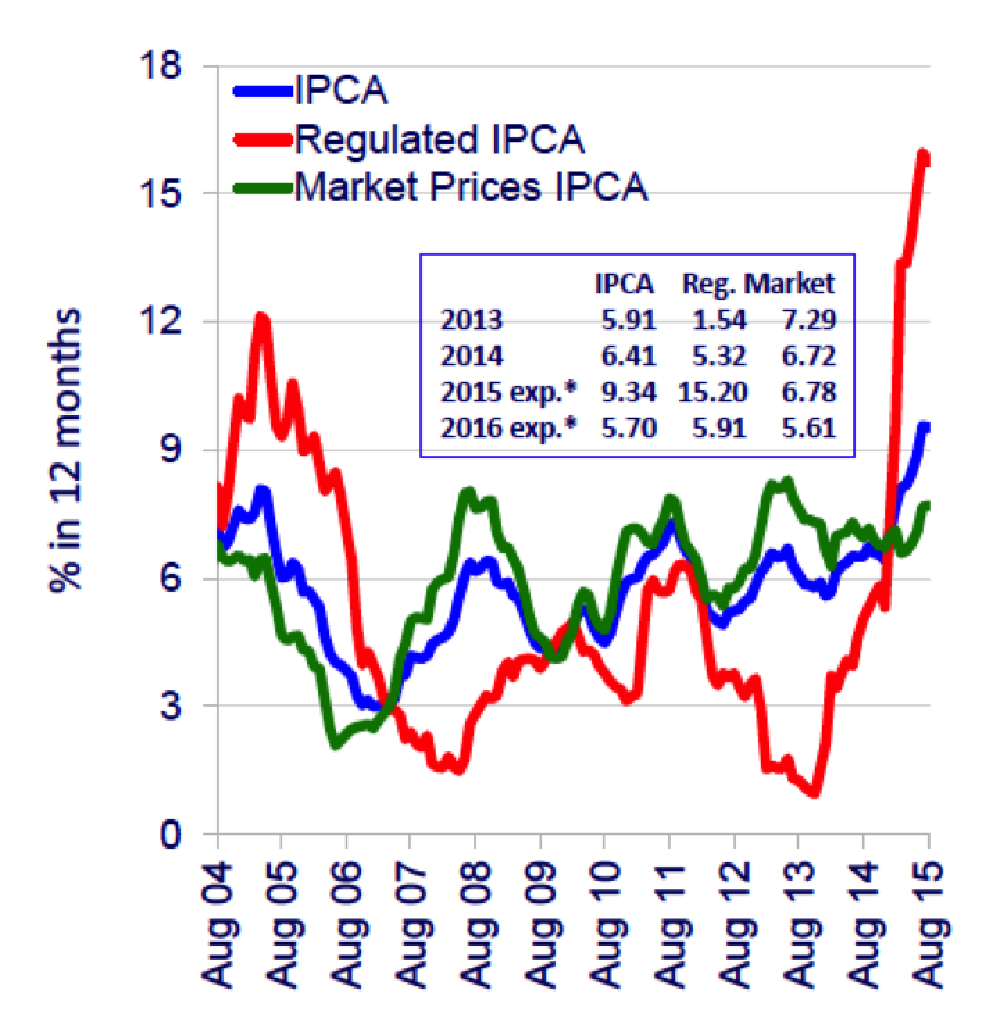
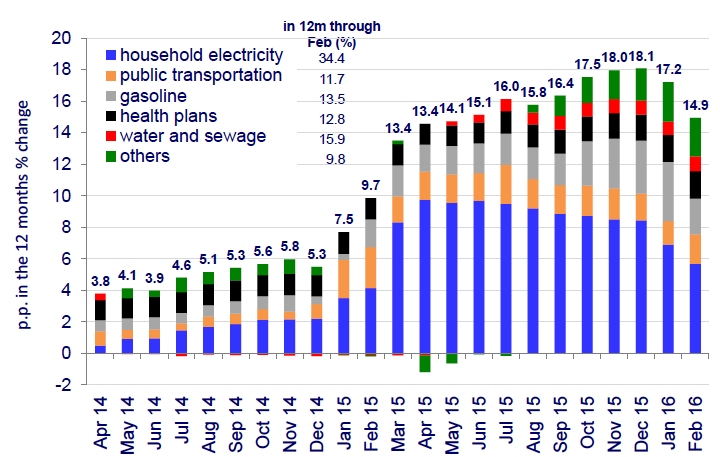
Ms. Roussseff attempted during her fist term to keep government-regulated prices low to tame inflation but this translated into higher budget deficits, which fueled the deficit hysteria. In an attempt to deal with widespread opposition to its policies and reduce its budget deficits, in 2015, the Ms. Rousseff’s administration decided to pass higher costs of government-regulated prices (such as electricity, gasoline and other regulated prices) on to consumers and firms. This led to further compressions in their incomes and accelerated inflation (figures 14 and 15).
Figure 14. Government-regulated and market prices
Source: BCB
Figure 15. Contribution to government regulated prices
Source: BCB
In addition, even though the government has been trying to reduce indexing in the economy, they introduced a formula, through the enactment of law 12.382/11, to readjust the minimum wage in Brazil that depends on prior-year inflation plus the level of GDP growth from the last two years. To be sure, it allowed real incomes to go up by doing this, but it also reintroduced an inertial component to changes in the price level in Brazil. To make things worse, the Brazilian central bank had initiated a series of rate hikes to 14.25% in July 2015 from 10% by the end of 2013, in an attempt to bring inflation to its target (figure 16).
Figure 16. Government Regulated prices and CPI (IPCA) inflation
Source: BCB
The perceived failure of stimulus measures opened up space for critics, such as the main centre-right opposition party, to blame Ms. Rousseff’s administration as being excessively interventionist leading the Brazilian economy to perform poorly during the past four years. It fueled Mr. Neves campaign to convince anti-Rousseff voters he could get Brazil’s economy back on track.
In Part IV, we’ll look at the Brazilian response to the crisis.
[1] See Mantega (2013) for more details. While the conventional belief points to state-based intervention and rising gross public debt as the cause of Brazil’s current crisis (Romero 2015), they overlook the growth of financial fragility in the Brazilian economy.
[2] The establishment of a target for the primary fiscal surplus would bring about a decline of gross public debt in relation to GDP to build investors’ confidence in the government ability to meet the debt service.


