New report JOLTS claim that extended benefits breed unemployment
byLast week, my colleague Tom Masterson commented on an op-ed piece by Robert Barro, which argued that much of the U.S. unemployment problem―perhaps 2.7 percentage points of the June unemployment rate of 9.5 percent―could be attributed to the availability of extended unemployment insurance benefits.
According to Barro’s argument, huge numbers of people are out of work by their own choice. In fact, data released yesterday from the Job Openings and Labor Turnover Survey (JOLTS) suggest that something very different is going on. Some economic theories about unemployment are based on the notion that workers use more of their time for leisure activities or full-time job search at times when their wages or salaries are relatively low. An example would be an ice-cream vendor who takes time off on cool or rainy days because sales are expected to be weak at such times. Along these lines, Barro has recently argued that Congressional extensions of benefit eligibility have made paid work less desirable for recipients whose checks might have been discontinued in the absence of new legislation.
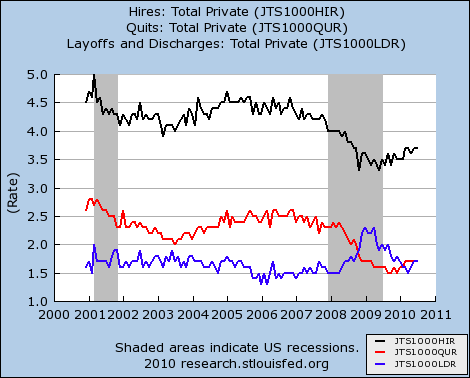
The figure above shows seasonally adjusted JOLTS data on the private sector for December 2000 through July 2010. This monthly survey, conducted by the Bureau of Labor Statistics, covers approximately 16,000 nonagricultural businesses. The black line shows that the estimated “hire rate” in the private sector was 3.7 percent in July. In other words, there were approximately 3.7 new hires in private industry for each 100 current employees in that part of the economy. This compares to 4.6 as recently as late 2006.
The other data series shown in the figure may shed more light on the validity of the leisure/job search explanation for high unemployment. The blue line shows the rate of “layoffs and discharges,” a category that includes all reported involuntary separations that were initiated by the employer. This figure peaked last spring at about 2.3 percent of the private-sector workforce and had fallen to a more typical level of 1.7 percent by July. The 2.3 percent figure, reached twice in early 2009, is the highest layoff and discharge rate for the period shown on the graph. Indeed, the graph shows a prolonged period beginning in late 2008 during which the rate of involuntary separations was well above the historical norm.
Finally, the “quit rate,” shown in red, is the percentage of workers who resign in the survey month, in this case July. For the private sector, this statistic fell from 2.3 percent at the start of the recession in 2007 to 1.7 percent in July. Hence, there has been only a modest increase in this rate since it bottomed out late last year at 1.5 percent. Recent low readings stand in stark contrast to an average observation of 2.4 percent for the period spanning December 2000 to November 2007. Such low quit rates strongly suggest that fewer rather than more workers than usual have been finding new jobs or resigning to take time off for job search, vacations, or home-based activities. The new statistics depict a job market in which many employees are losing their jobs or at least believe that it will be very difficult to find new jobs if they leave their current ones.


