Unemployment Figures and the Uncertain Future
byWe expect the unexpected at the Levy Institute. As followers of Keynes, most economists here, including this author, believe that one cannot assign exact probabilities to most important economic outcomes even, say, six months into the future.
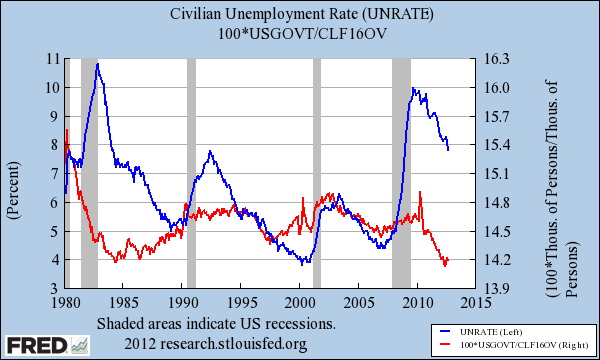
On the other hand, thinking about the economic debate on job creation, and the recent release of new jobs data, I have not been very surprised at the gradual pace of progress in reducing the unemployment rate. In fact, we on the macro team have consistently called for more fiscal stimulus rather than less. The reason is that unemployment is a relatively slow-moving variable. As the chart at the top of this post shows, the unemployment rate (shown as a blue line) fell only rather gradually after each of the previous three recessions (shown as shaded areas in the figure). (Here, we count the double-dip recessions of 1980 and 1981–82 as one.) Hence, once the recovery began, we knew that with the unemployment rate at very high levels, it needed to fall unusually fast to be at reasonable levels by this point in the Obama administration. Hence, since 2007, the team has advocated an easing of fiscal policy. Instead, especially after the 2009 ARRA, little action was taken by the government to stimulate the economy. Partly as a result of inaction on fiscal stimulus, government employment as a percentage of the civilian workforce (red line in the figure above) peters out after 2010.
At this point, we hope for legislation to moderate January’s expected “fiscal cliff”—which will lead to perhaps a $500 billion in reductions in the federal deficit in 2013 unless laws are changed, by CBO estimates. (In its current form, the cliff would probably have a serious impact on all economic and demographic groups. Lately, I’ve been working on a model that incorporates the larger effects of an additional dollar of income on spending at lower income levels—not a simple task.)
In the figure, both lines are shown in the same units, namely percentages of the civilian labor force age 16 and above, though the two lines use different scales, one on each side of the figure. For example, a one-unit change in the blue line represents the same number of workers as a move of one unit in the red line. A hypothetical jobs program or another spending measure that gradually increased government employment (red line) by, say, 1 percent of the total US workforce might easily have led to an unemployment rate (blue line) for last month of 1 to 3 percent less than the actual reported amount. But government does not seem to be expanding; in fact, the red line shows that government employment shrank at a time when more hiring from that sector would have been of great help to the economy. (The figures include employees of local and state governments, as well as those of the federal government. The smaller governmental units have seen the biggest cuts in payrolls.)
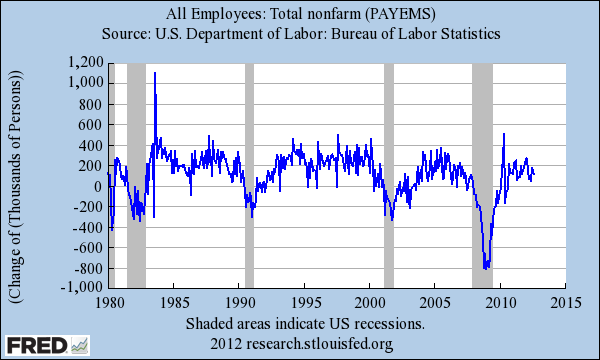
Of course, we knew that our surmises about unemployment might turn out to be wrong. Moreover, few could claim to have forecast the exact 7.8 percent unemployment figure, say, 12 months ago. But, given the gradually downward-sloping drops in unemployment shown in the figure above corresponding to each of the most recent post-recession employment recoveries, we needed a very large number of above-par performances in monthly job creation (see figure below) to bring the unemployment rate down to levels that we as Keynesians would consider acceptable in this country—say, 4 to 5 percent. It is these monthly jobs-creation numbers, rather than unemployment rates in the figure at the top, that seem to bounce around like draws from a random-number generator, suggesting that uncertainty plays a more significant role in this case. Especially after 2007, when the unemployment rate began to skyrocket (look again at the blue line in the figure above), policymakers needed to improve on the luck of the draw using a rather large push from macroeconomic policy to increase the mean of the draws. Clearly, such a push is still in order, even after the Fed’s somewhat encouraging announcement last week that it intends to make $40 billion in purchases of mortgage-backed securities each month for an indefinite period.
Edited slightly by author, 6 pm, October 12.


